
Start in three steps
Read current from a virtual iEM3000 meter and verify a load change in your Modbus TCP client.
Before you start: Install SPX with the Modbus package and SPX UI. Have a Modbus TCP client ready. This guide uses the library’s iEM3000 meter model.
1. Create a virtual meter
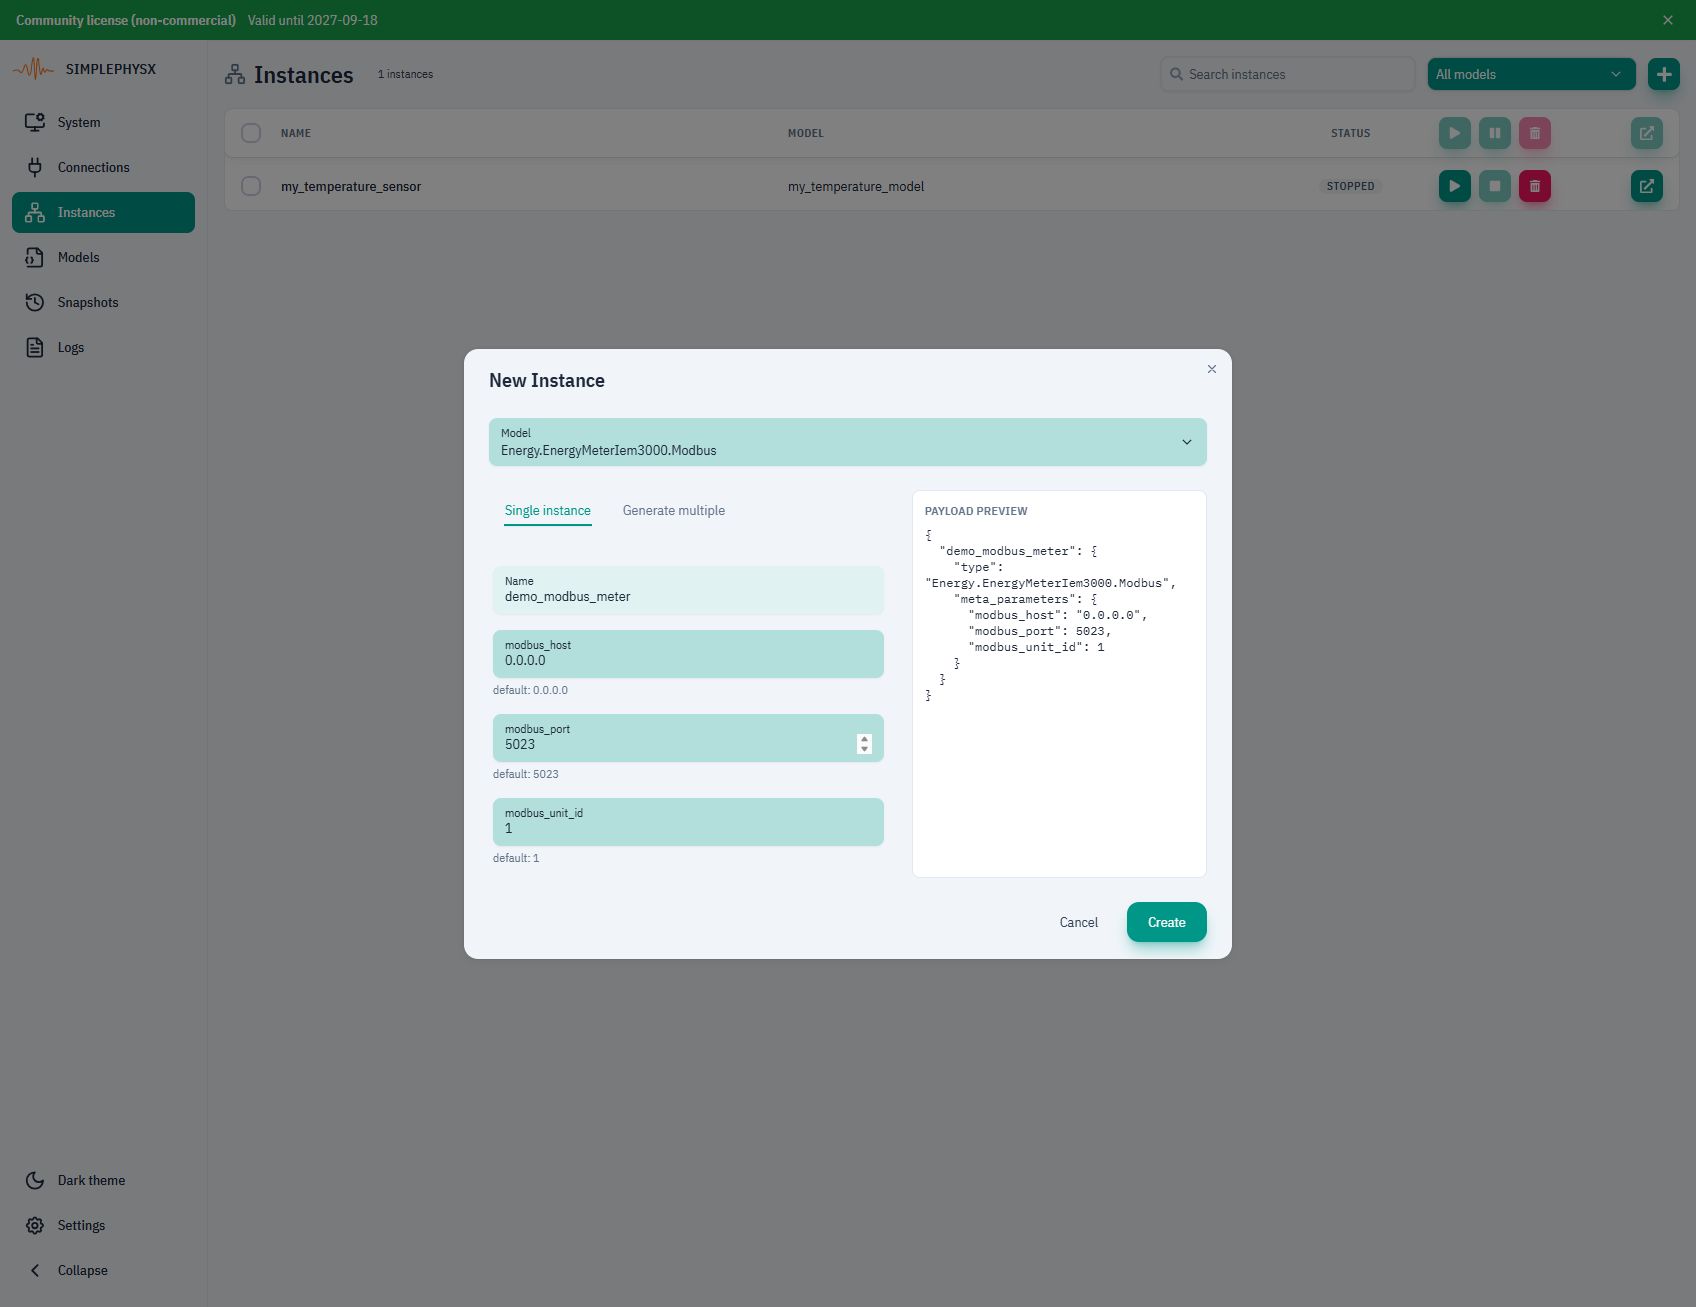
Open Instances → New instance. Select Energy.EnergyMeterIem3000.Modbus, or the registry name you used when importing the model. Use an unused name, such as demo_modbus_meter; keep port 5023 and unit ID 1. Choose Create, then Start instance. Confirm RUNNING.
Model not listed?
Download the library YAML linked above. In Models → Load model from file, import it under a registry name of your choice. Select that name in New instance. The dotted name in our screenshots is a registry label, not the YAML filename.
2. Connect and read the current
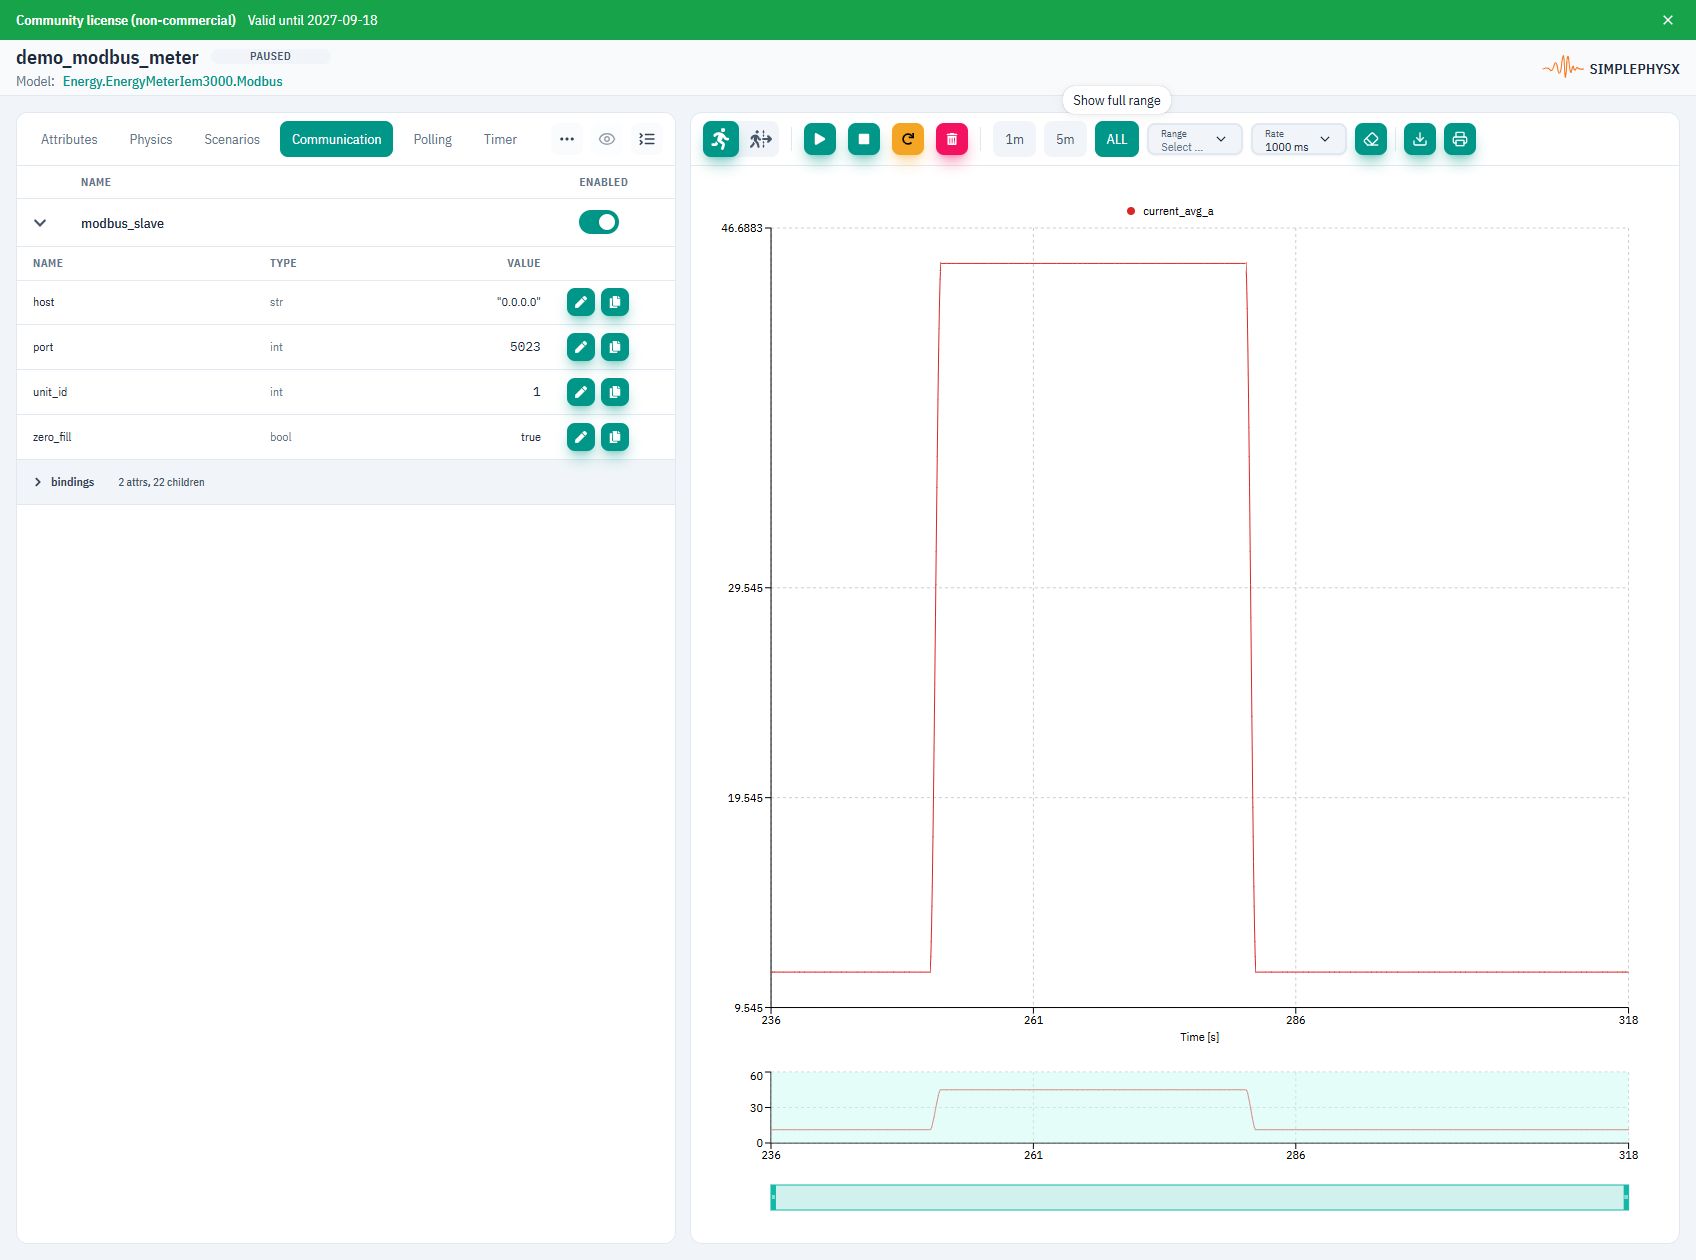
Open Communication → modbus_slave. Connect your client to the host running SPX and its published TCP port. In our Docker setup, host port 15023 maps to the adapter’s port 5023; use your own port mapping.
Select unit ID 1, FC04, raw start address 3000 and count 2. Decode the two registers as Float32, big-endian bytes and words. Check: the nominal phase L1 current is 12 A. The communication reference lists additional measurements and address conventions.
3. Run a load change and verify it
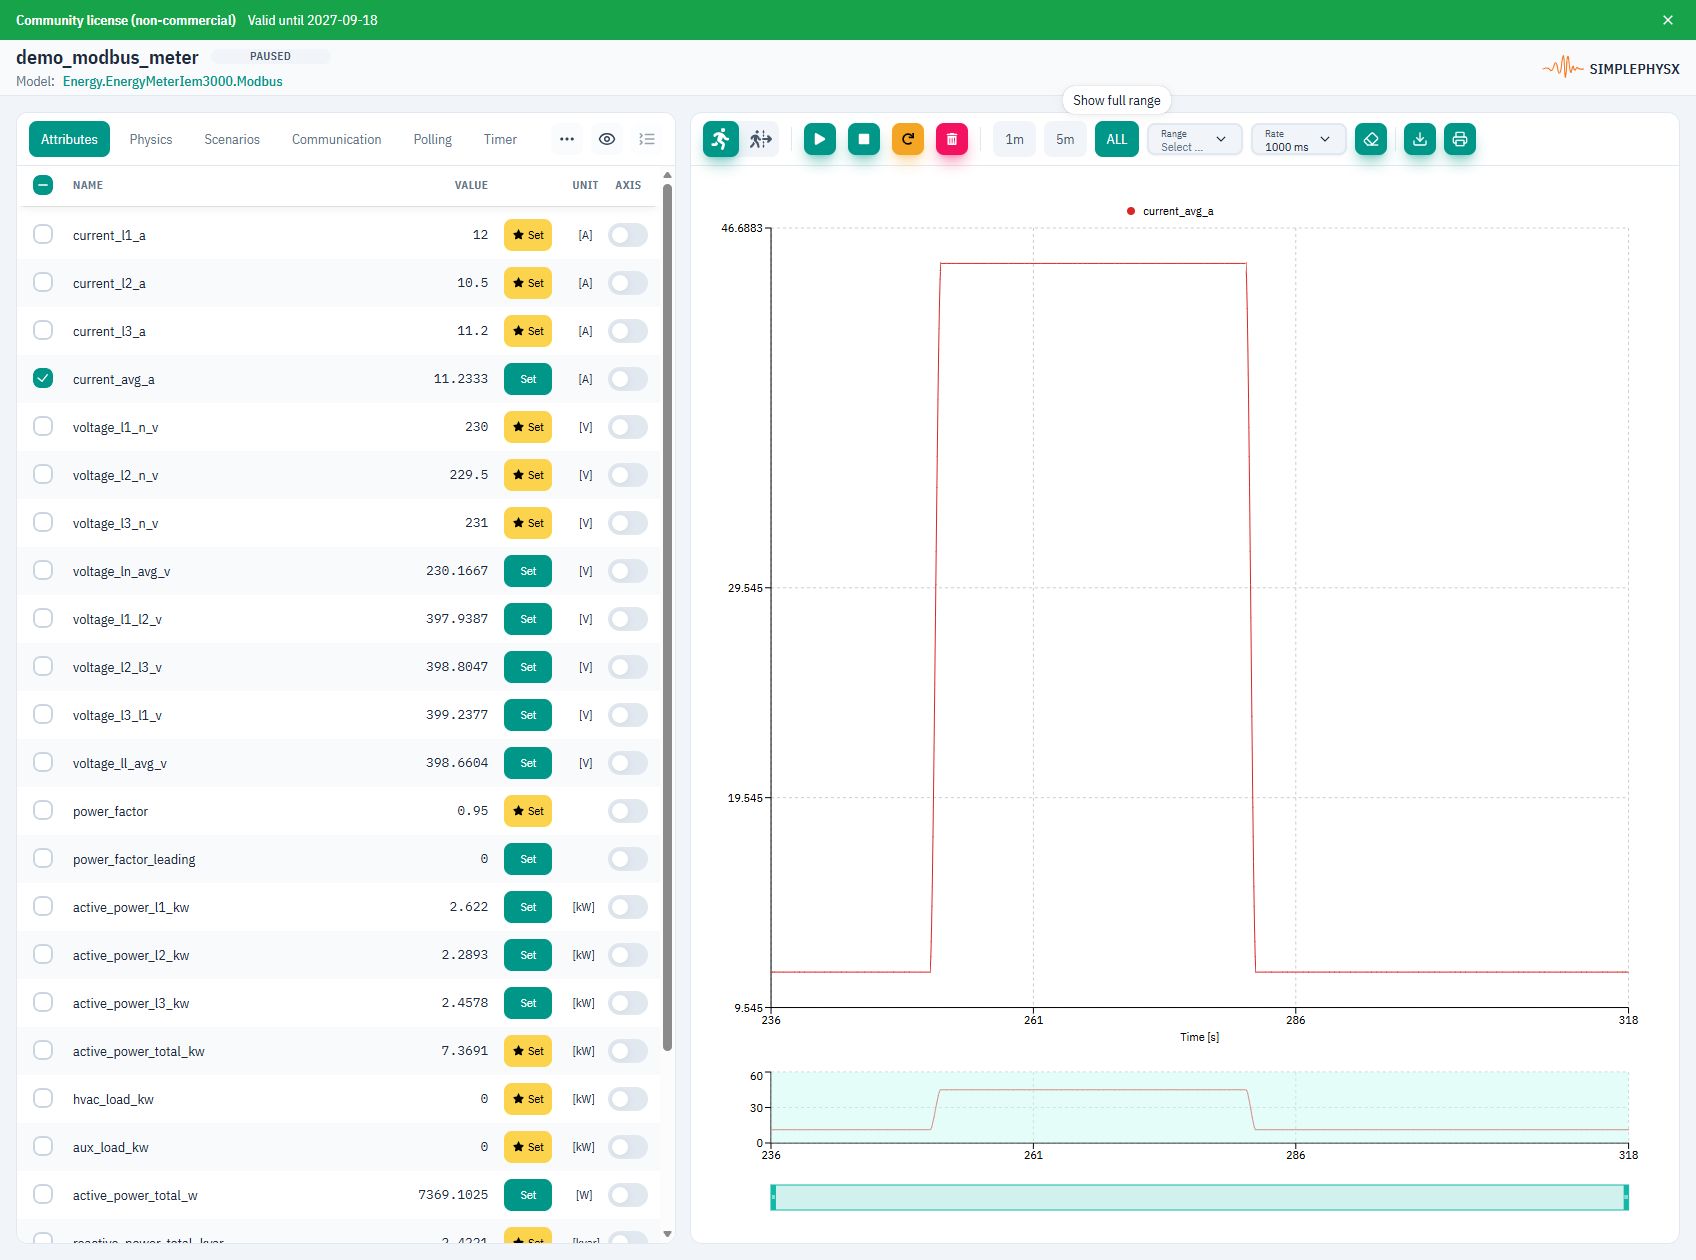
Keep polling the same registers. Before starting the scenario, open Attributes, select current_avg_a and use a shared A axis with a 1000 ms chart rate. In Scenarios, choose Start peak_demand scenario and let the 30-second run finish.
Success: your Modbus client reads phase L1 at 12 → 45 → 12 A. The chart shows the three-phase average at approximately 11.23 → 45 → 11.23 A. Pause after the scenario and choose ALL to inspect the complete pulse.
When finished, choose Stop instance.
Protocol communication
Use these settings and messages with the library’s iEM3000 meter model.
- Client / transport
- Modbus TCP → SPX_HOST:5023; unit ID 1
- Docker example
- Our capture maps host TCP 15023 → adapter 5023; use your published port
- Value format
- Float32; 2 consecutive 16-bit registers; big-endian bytes and words
Replace host placeholders with reachable addresses and use your published ports.
Swipe the table to see requests and replies.
| Address / message | Operation / payload | Expected reply |
|---|---|---|
3000–3001 | FC04; start 3000; count 2 — phase L1 current | 12.0 A at the nominal baseline |
3010–3011 | FC04; start 3010; count 2 — average current | About 11.23 A after the first simulation updates |
3028–3029 | FC04; start 3028; count 2 — L1-to-neutral voltage | 230.0 V at the nominal baseline |
3110–3111 | FC04; start 3110; count 2 — frequency | 50.0 Hz at the nominal baseline |
45100–45101 | FC03; start 45100; count 2 — imported energy | Float32 kWh total; increases while the meter runs |
Values describe this model’s nominal setup unless noted. Live measurements change as the simulation runs.
Example request and reply
Poll 3000/count 2, run peak_demand in SPX, and verify 12 → 45 → 12 A. This exercise reads measurements; no Modbus write is needed.
ReadInputRegisters(unit=1, address=3000, count=2)
→ words [0x4140, 0x0000] → Float32 big-endian: 12.0 A
During peak_demand:
→ words [0x4234, 0x0000] → 45.0 A
No reply or an unexpected value?
- SPX_HOST is the reachable server host, not the listen address 0.0.0.0. The published port may differ from 5023.
- Addresses are raw zero-based addresses. Use input registers/FC04 for current and holding registers/FC03 for energy. Do not add a 3xxxx/4xxxx display prefix to the raw address.
- Unexpected near-zero or huge numbers usually mean the wrong Float32 byte/word order. Read both registers together.
What you can test next
- Decode other measurements from the meter’s register map.
- Repeat load changes to test your client’s response.
- Run
voltage_sagorfrequency_driftand read the corresponding measurements.
Using an AI agent?
Give your agent this page and the linked YAML. Resolve the registered model name and published port from your environment. Use SPX tools to run the instance and scenario, then a Modbus client to verify the readback. Report the address, decoding and observed values. The phase L1 model attribute is k__current_l1_a.
See the Modbus adapter guide for mappings and advanced settings.